


Hey,
My name is Christopher J. Galletta, I’m a junior studying Computer Science and in my spare time I am usually either mountain biking, following the ever-changing puzzle of politics, or going to town on some code. My dream is to create software products that entertain & inform. As a hobby, my childhood friend and me run a site called Outside Perspective where we analyze & critique the current political climate.
Spending hours finding an interesting data set for my class assignment, I arrived at a very recent political subject of terrorism in the United States and the 90-day travel ban President Trump has recently enacted and found a data set on all US Terrorist Perpetrators from 2001 to 2016. Credit to the data set Terrorism Cases 2001-2016

Roughly looking through the set, there is about 400 records in the .csv with fields like terrorist age, marital status, gender, citizenship, residency, and more. I wanted to see if there was an age correlation with citizen type between the offenders. As a result of wanting to plot this, i wrote a quick command into R:
boxplot(names_of_perpetrators$'age'~names_of_perpetrators$citizenship_status, main = "Terrorist Act Age & Citizenship Type", xlab = "citizenship type", ylab = "age")
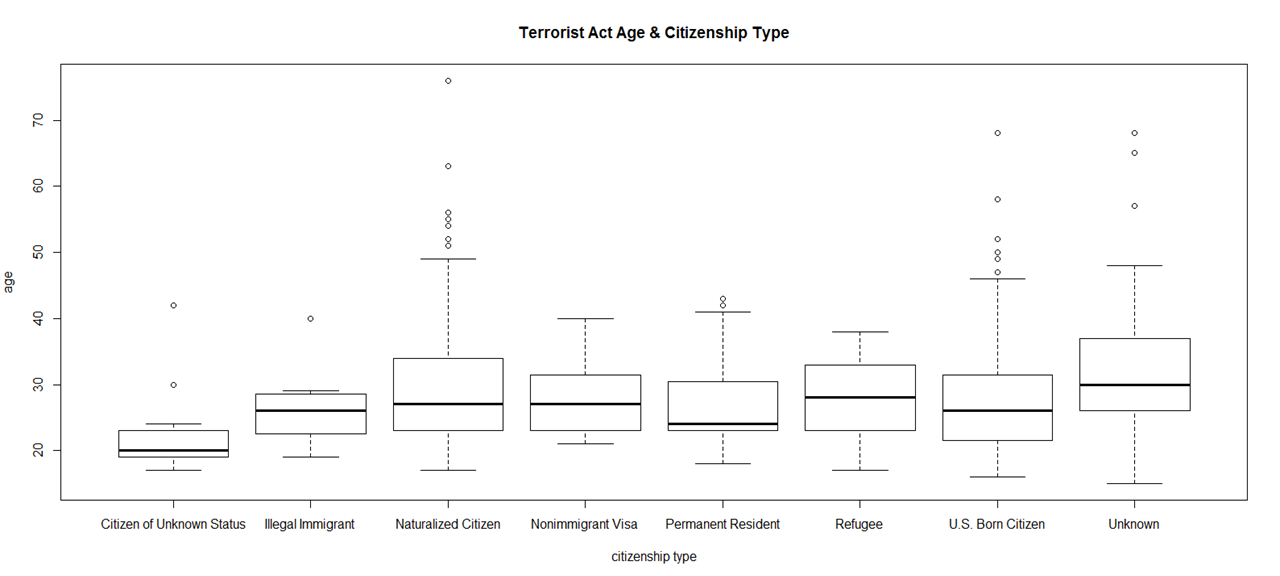
What’s interesting from the plot is that we see that the bulk age of terrorist offenders is between late teens to mid-20s. Around age 40+ it amount tapers off even though there are offenders who are around the age of 60+. Could the age gap we see, imply that the youth are more susceptible to radicalization?
Looking at the Citizenship Type plot, we see it is not just immigrants and refugees but born Americans as well. Its also important to note from looking at this plot that Naturalized Citizens have the widest age range.

After analyzing the previous plot, i wanted to see if there was any interesting finds by comparing Age and Last Known Residency of the terrorist offenders. I wrote a command to plot it in R:
boxplot(names_of_perpetrators$'age'~names_of_perpetrators$last_residency_country, main = "Terrorist Act Age & Last Known Residency", xlab = "last known residency", ylab = "age")
From the plot of Age vs. Last Known Residency it shows that a majority of terrorist crimes are carried out by American Citizens which is Domestic Terrorism. The second largest Residency of offenders from the set is from Syria. Which Syria is one of the current 7 countries under President Trumps travel ban next to the United Arab Emirates.
Since the majority of terrorist offenders in the set besides American born, are naturalized citizens which are foreign citizens who became American citizens legally. The data set does not contain their country of birth/origin, just their Last Residency as a Naturalized Citizen. This missing data would further produce more interesting data and statistics to this set. Next im thinking of including a world terrorism data set to the US set and see if there are any more patterns to be found in age, citizenship type and last known residency.
Hope you have enjoyed my analysis on this data set.
Any inquiries, you can contact me at chris@consciousinteractive.com